jrun status
Show VM and jail status.
Overview
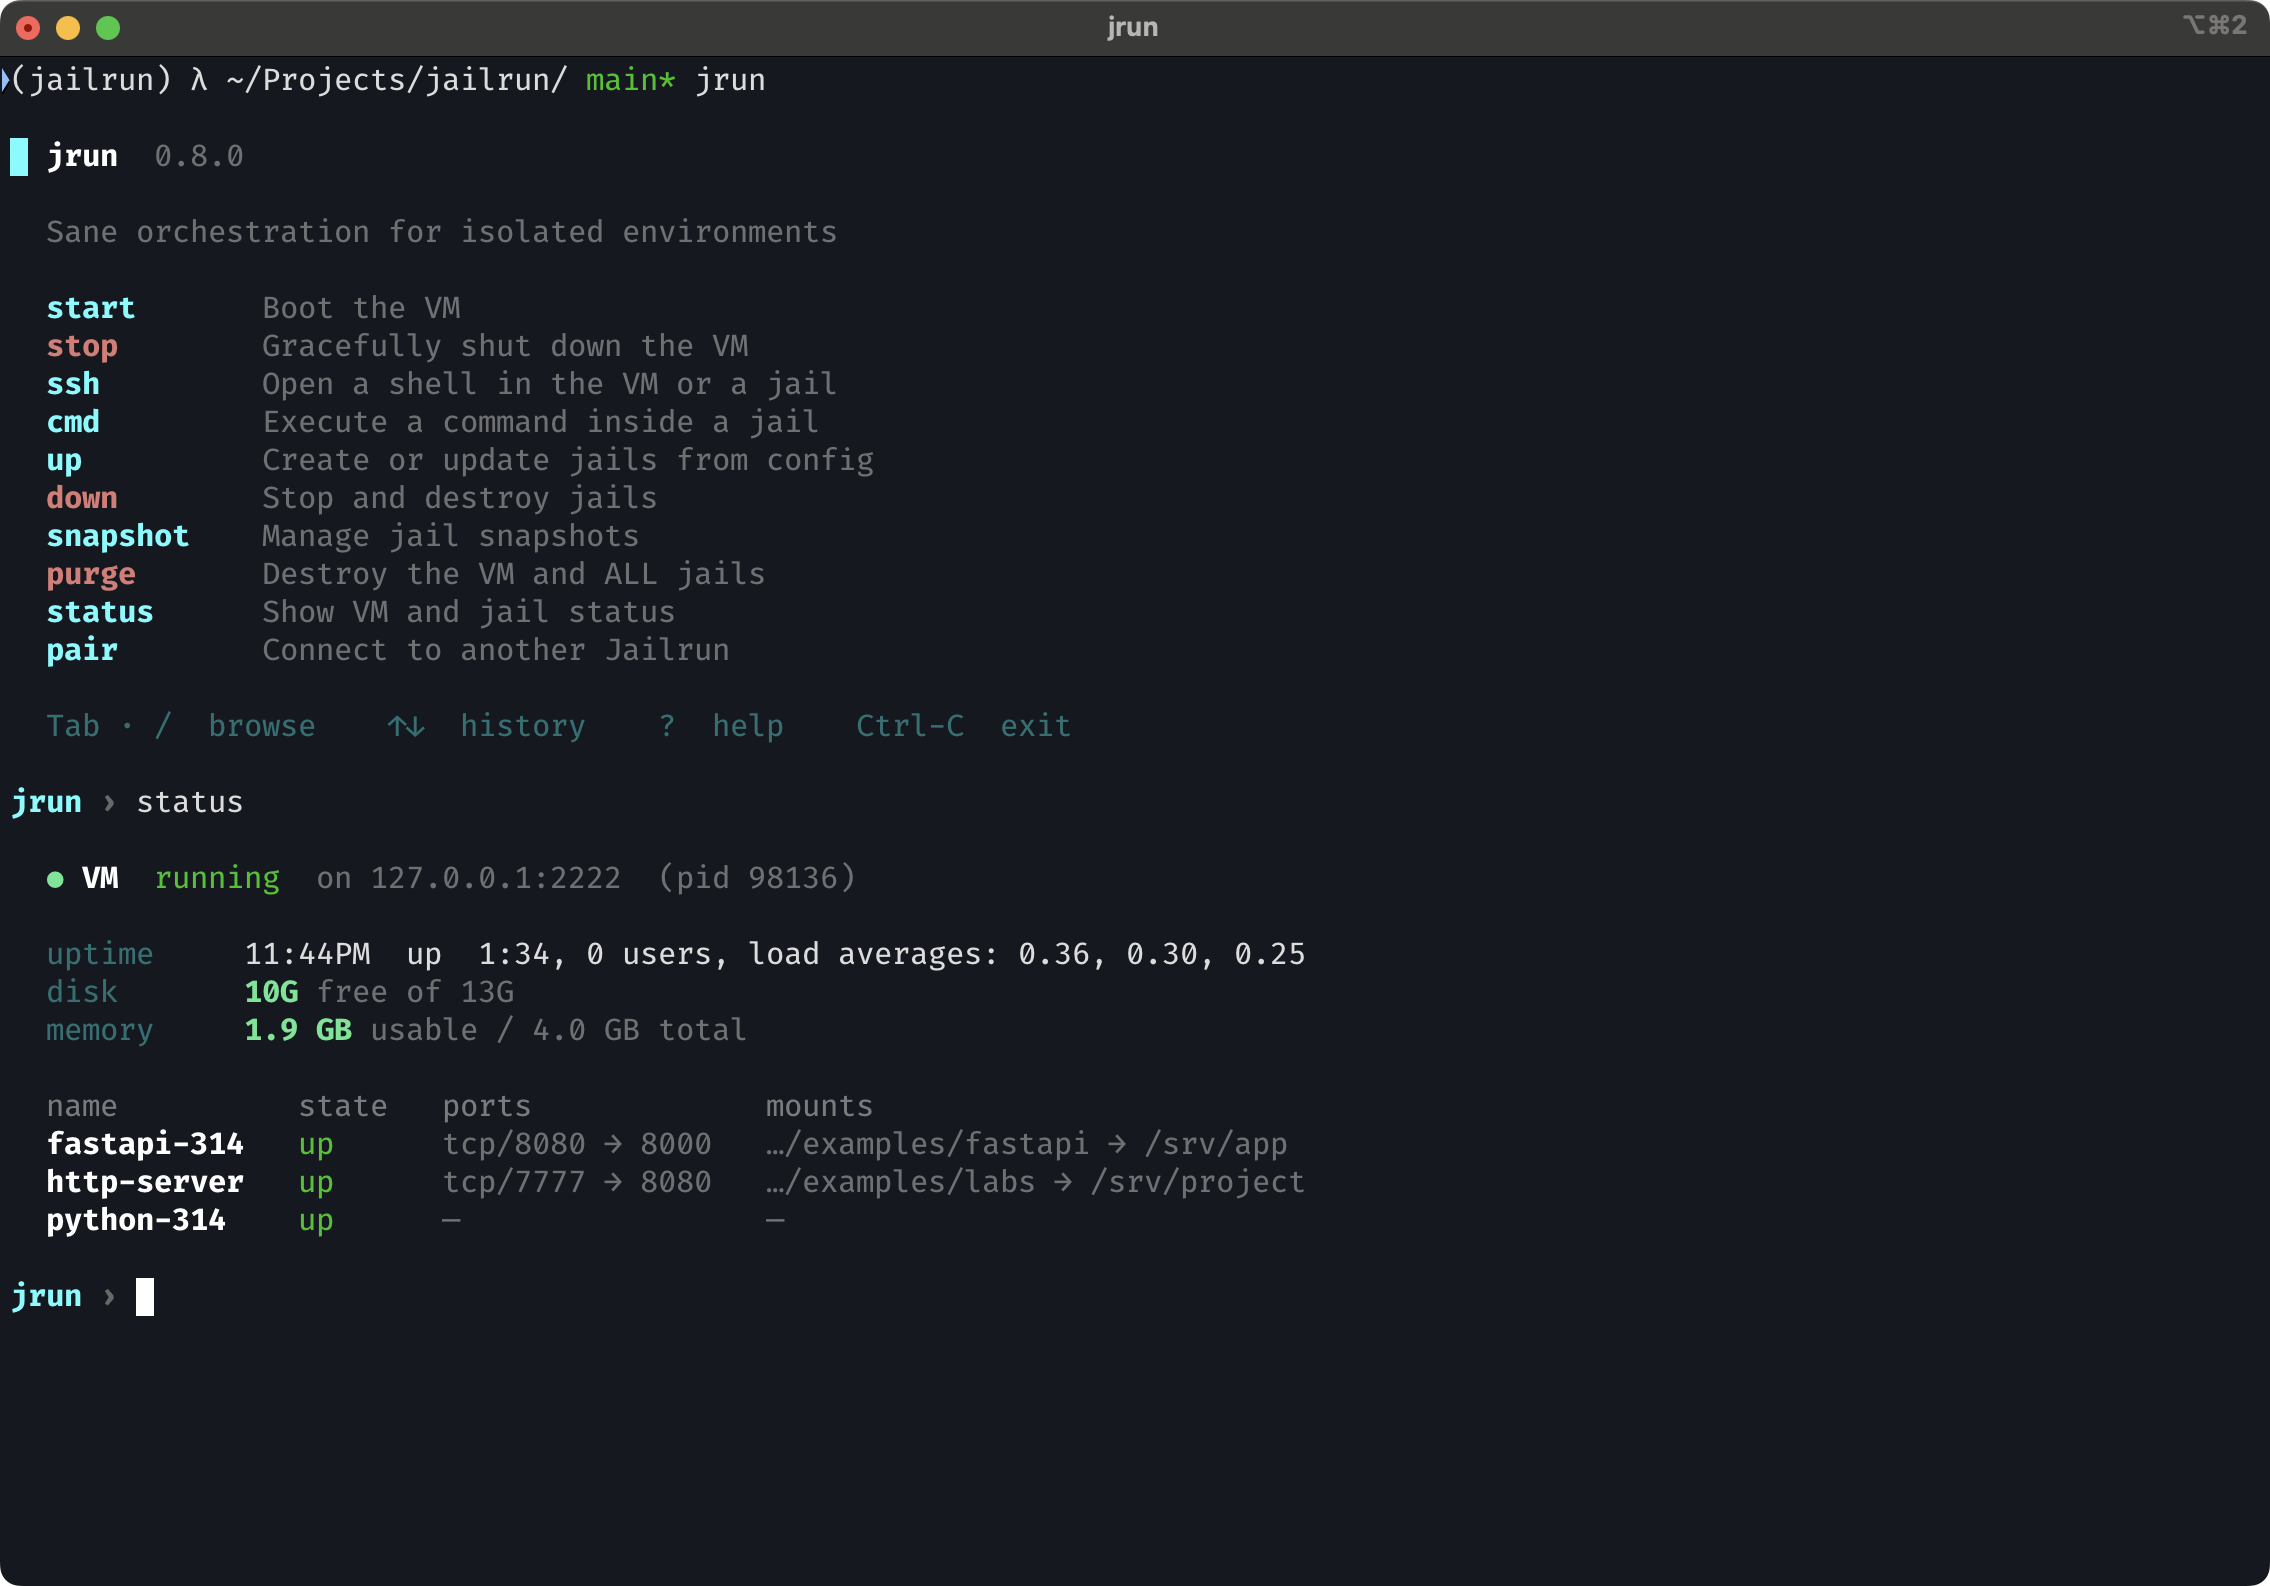
Extra columns
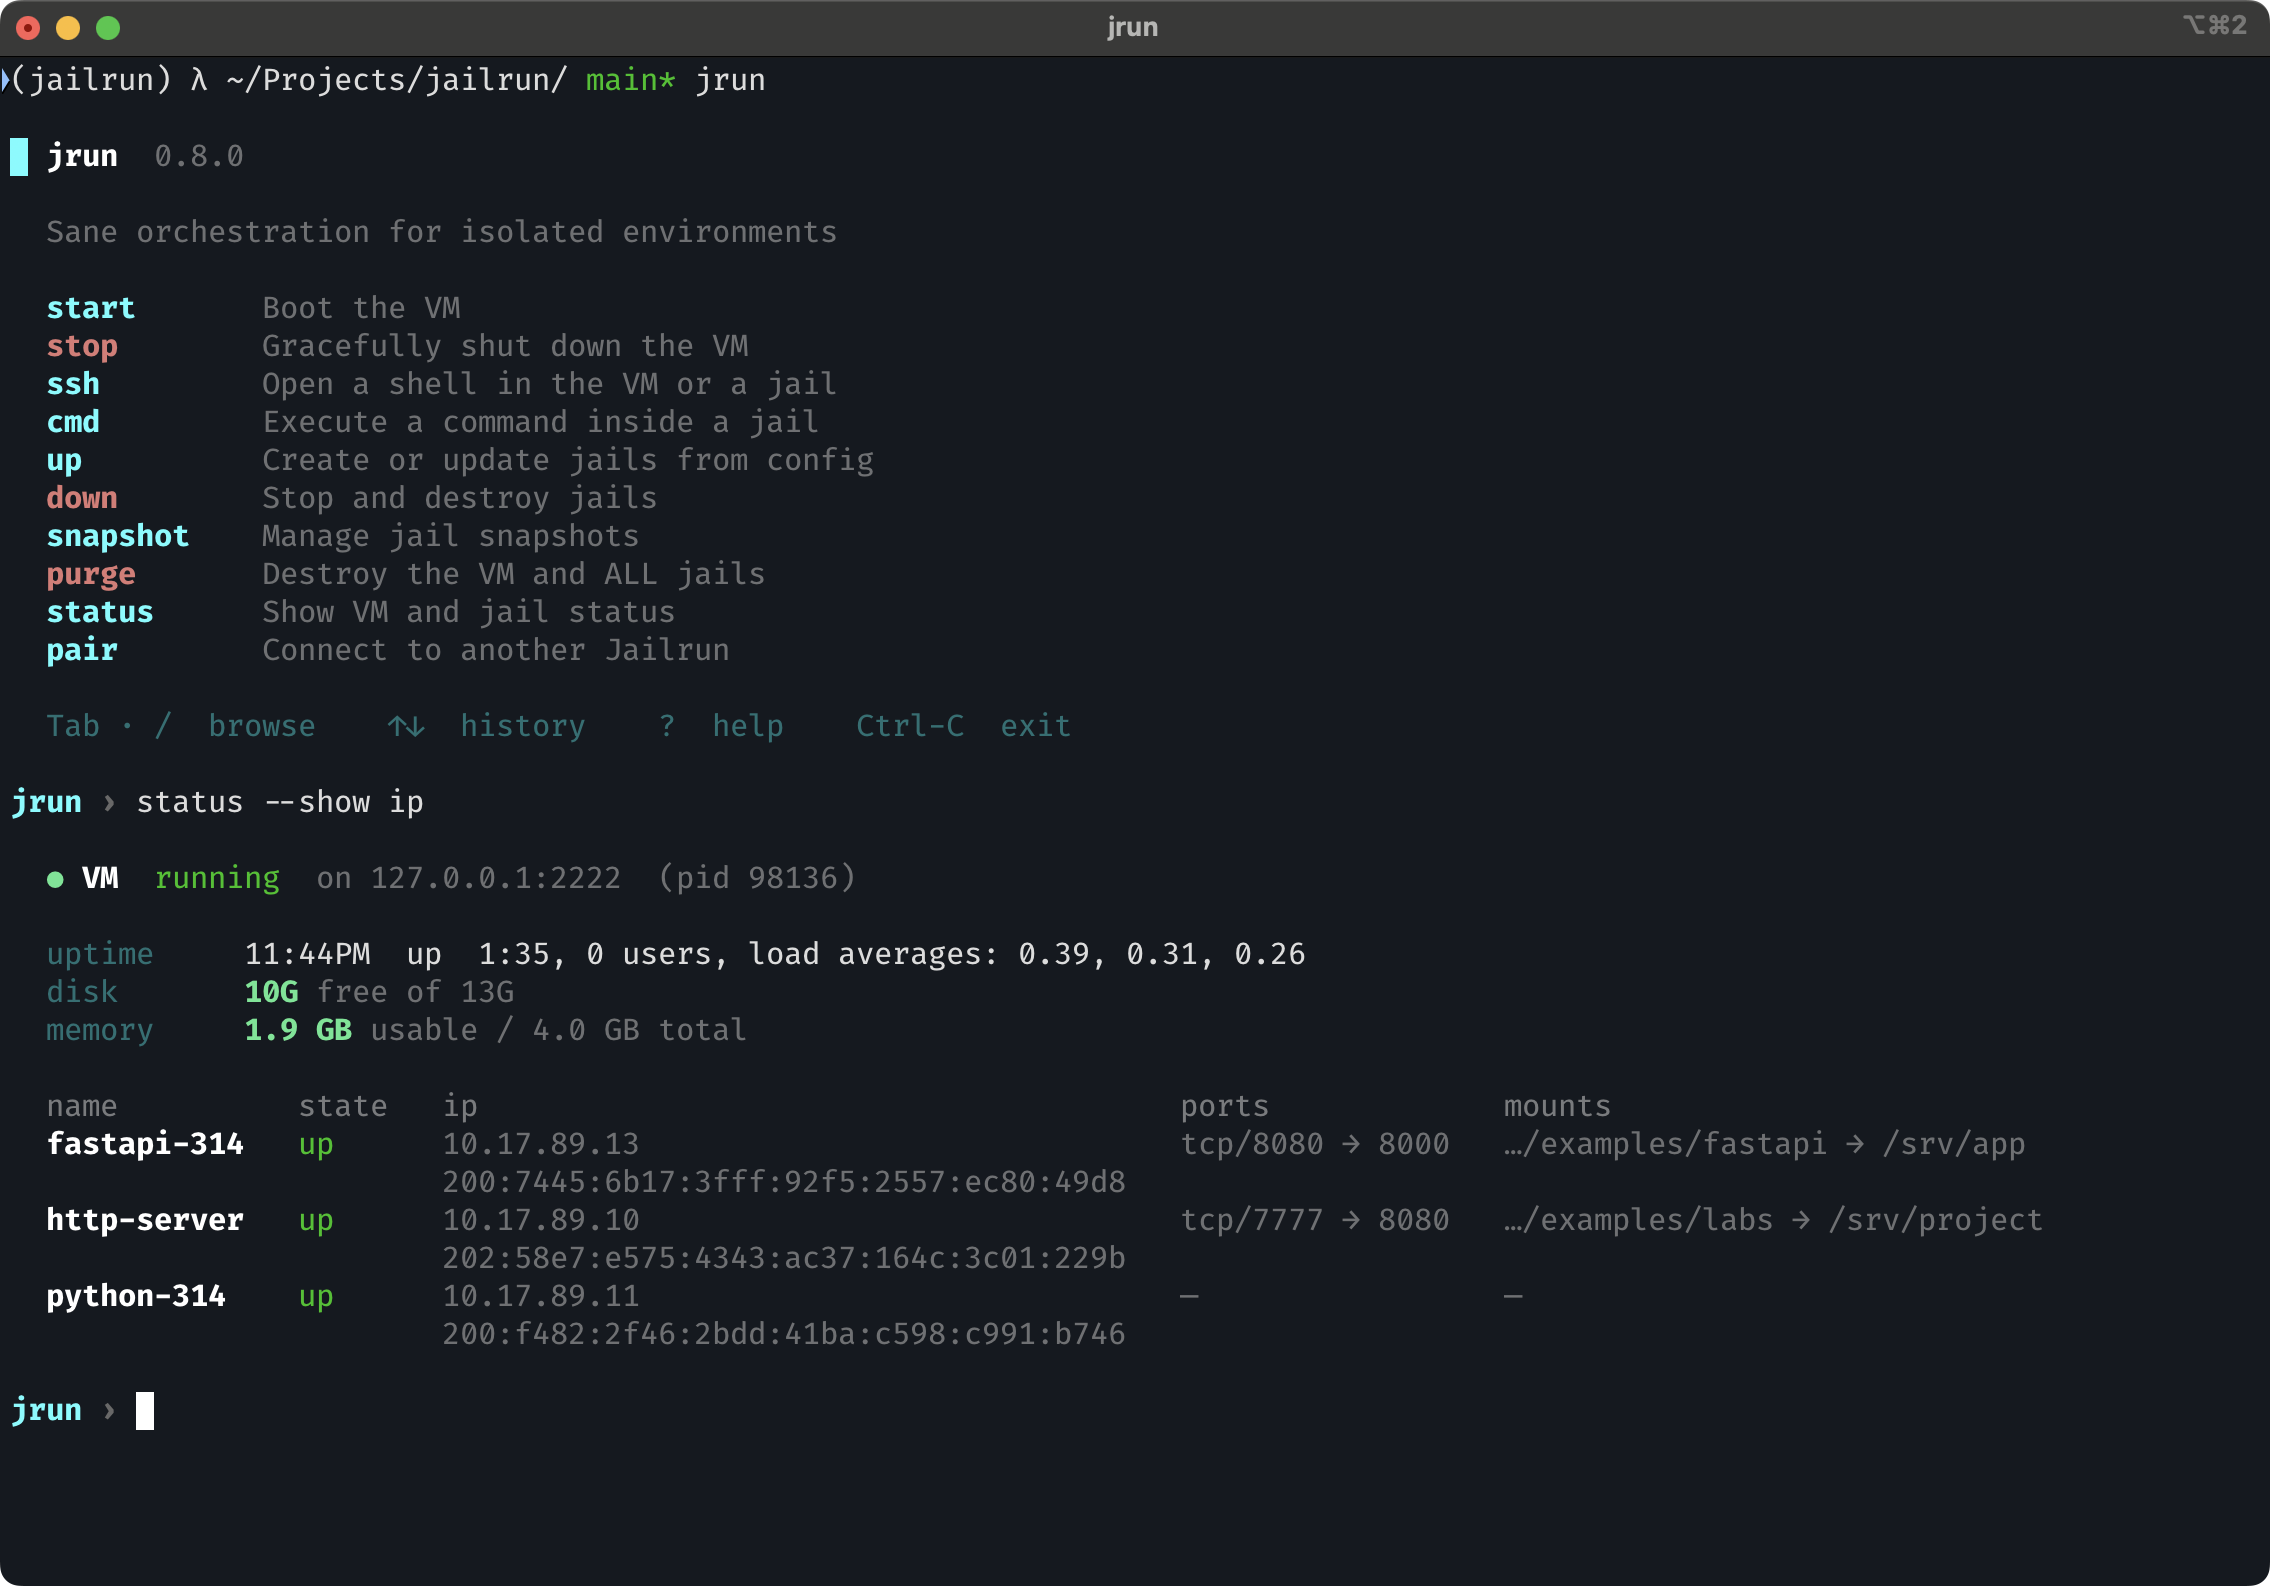
Use --show / -s to add columns to the overview table.
jrun status --show ip
jrun status --show services
jrun status --show ip --show services
jrun status --show all                  # shorthand for ip + services
Tree view
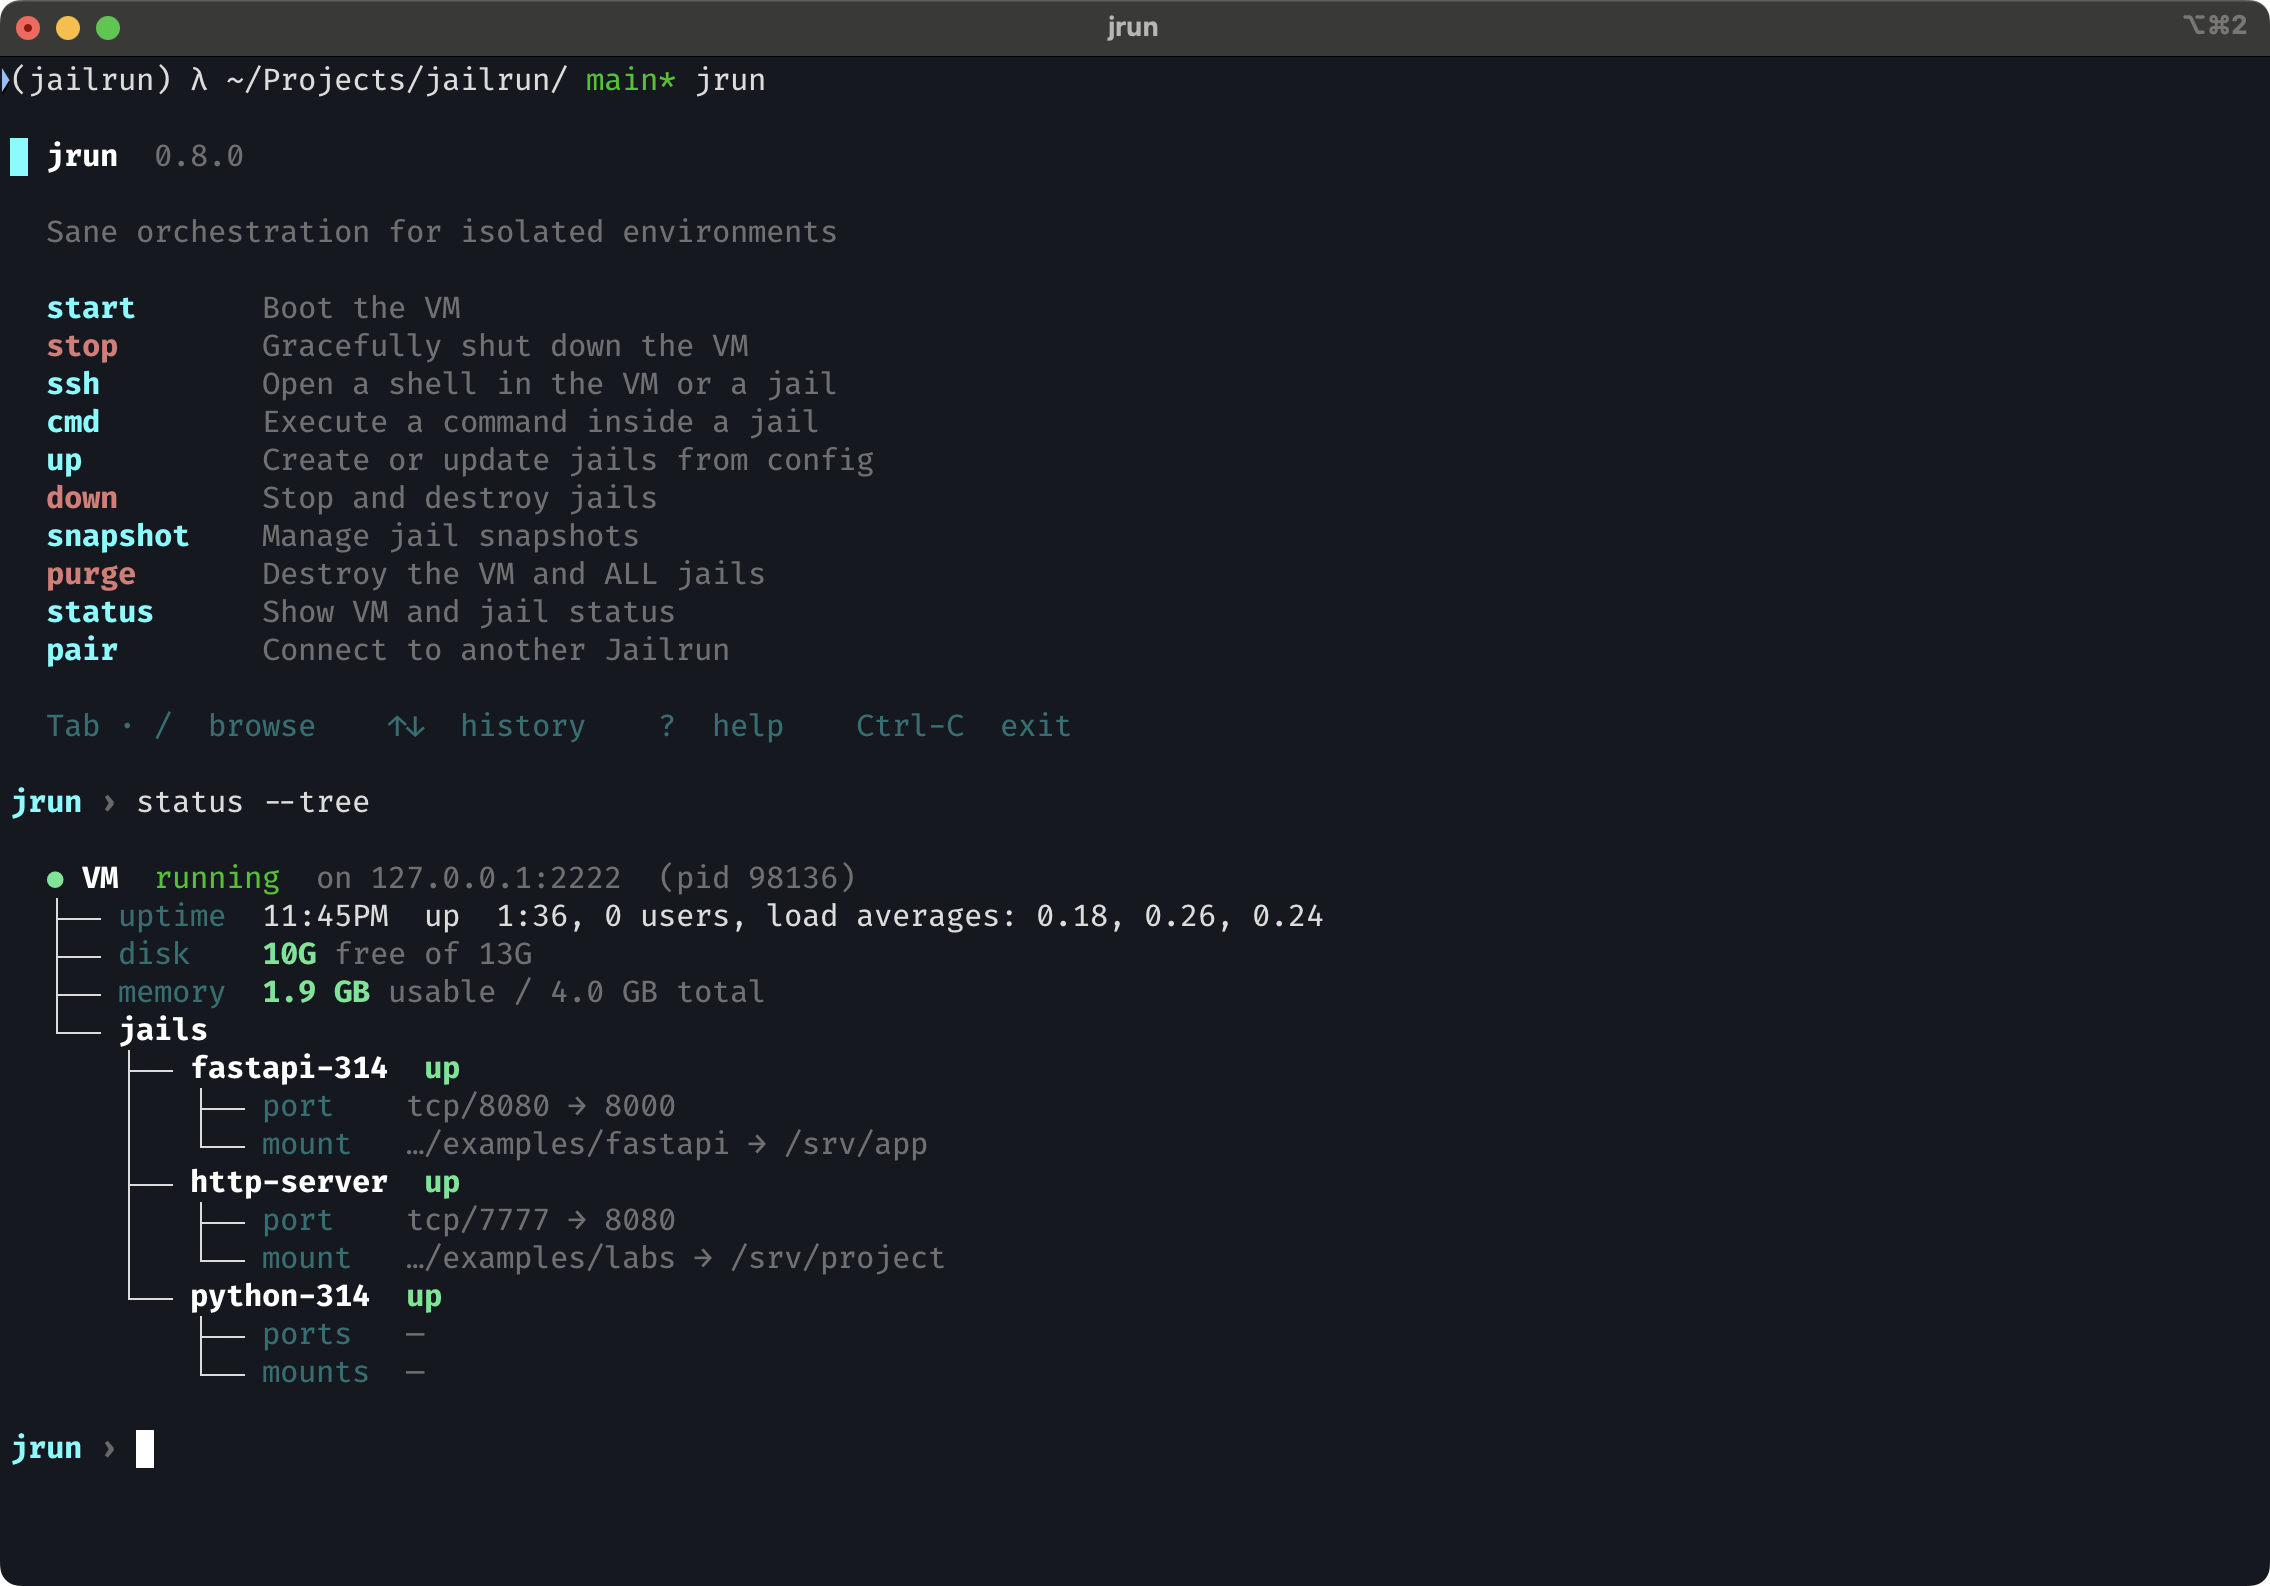
Tree view also respects --show:
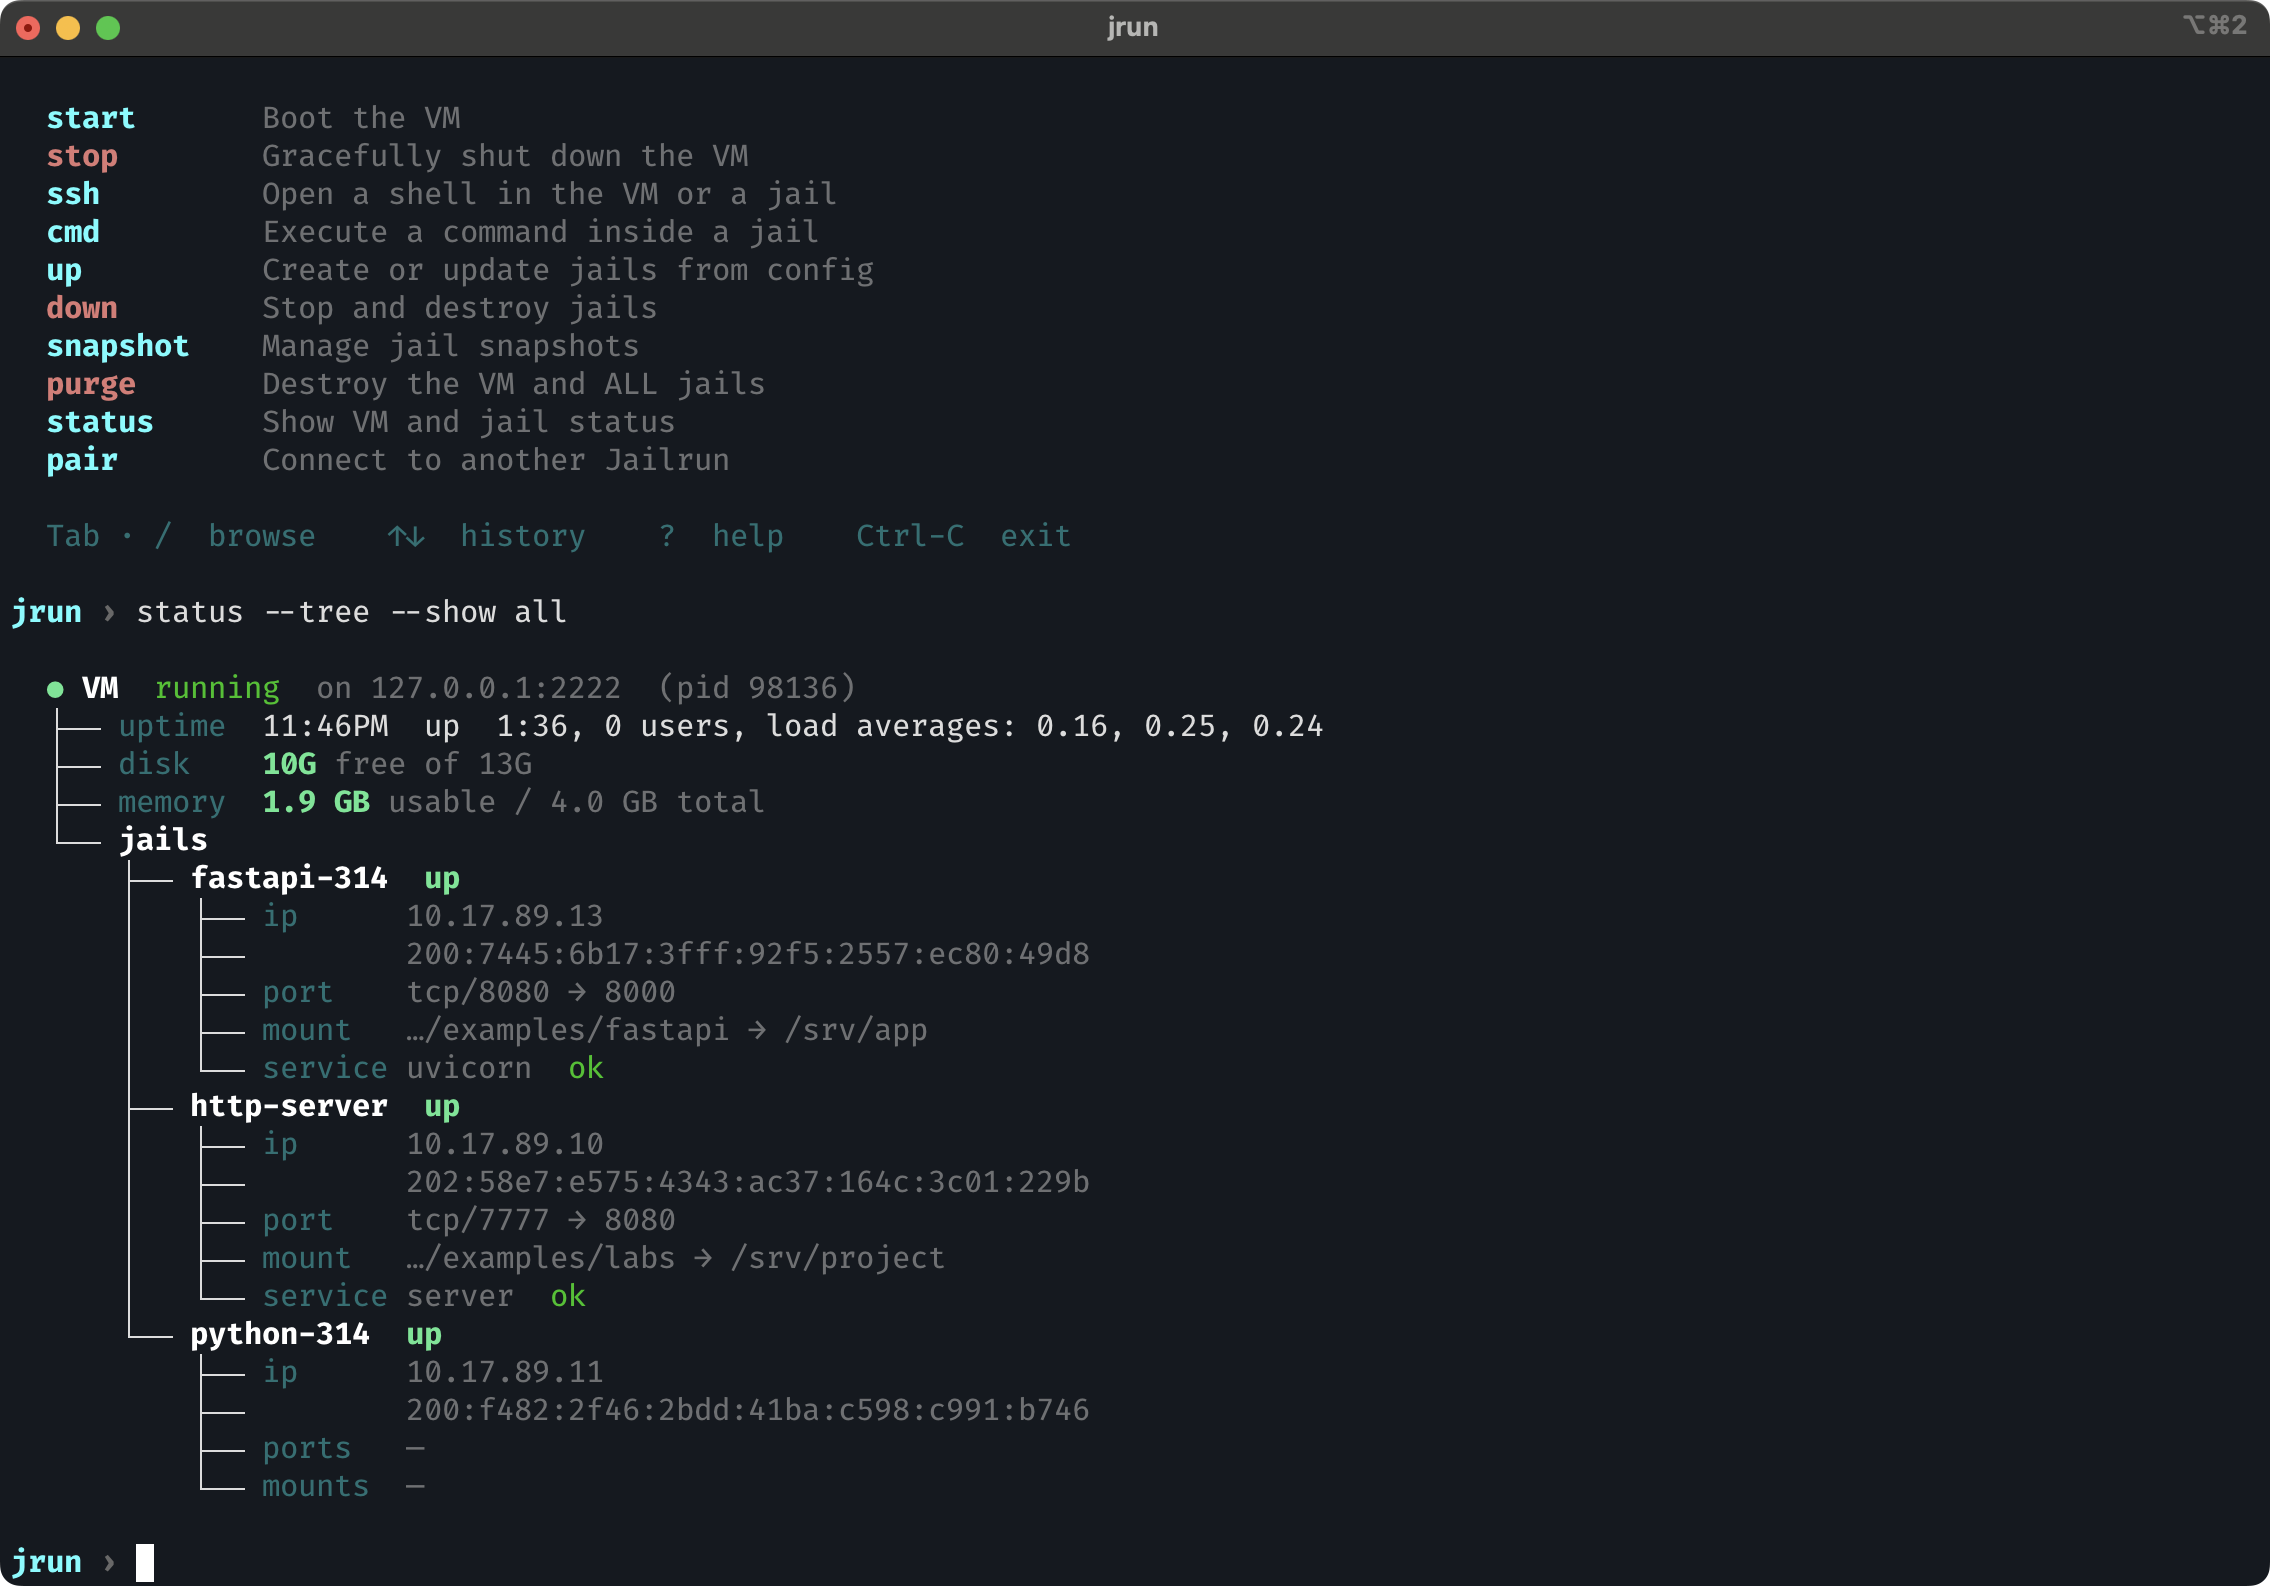
This adds ip rows and service rows to each jail node.
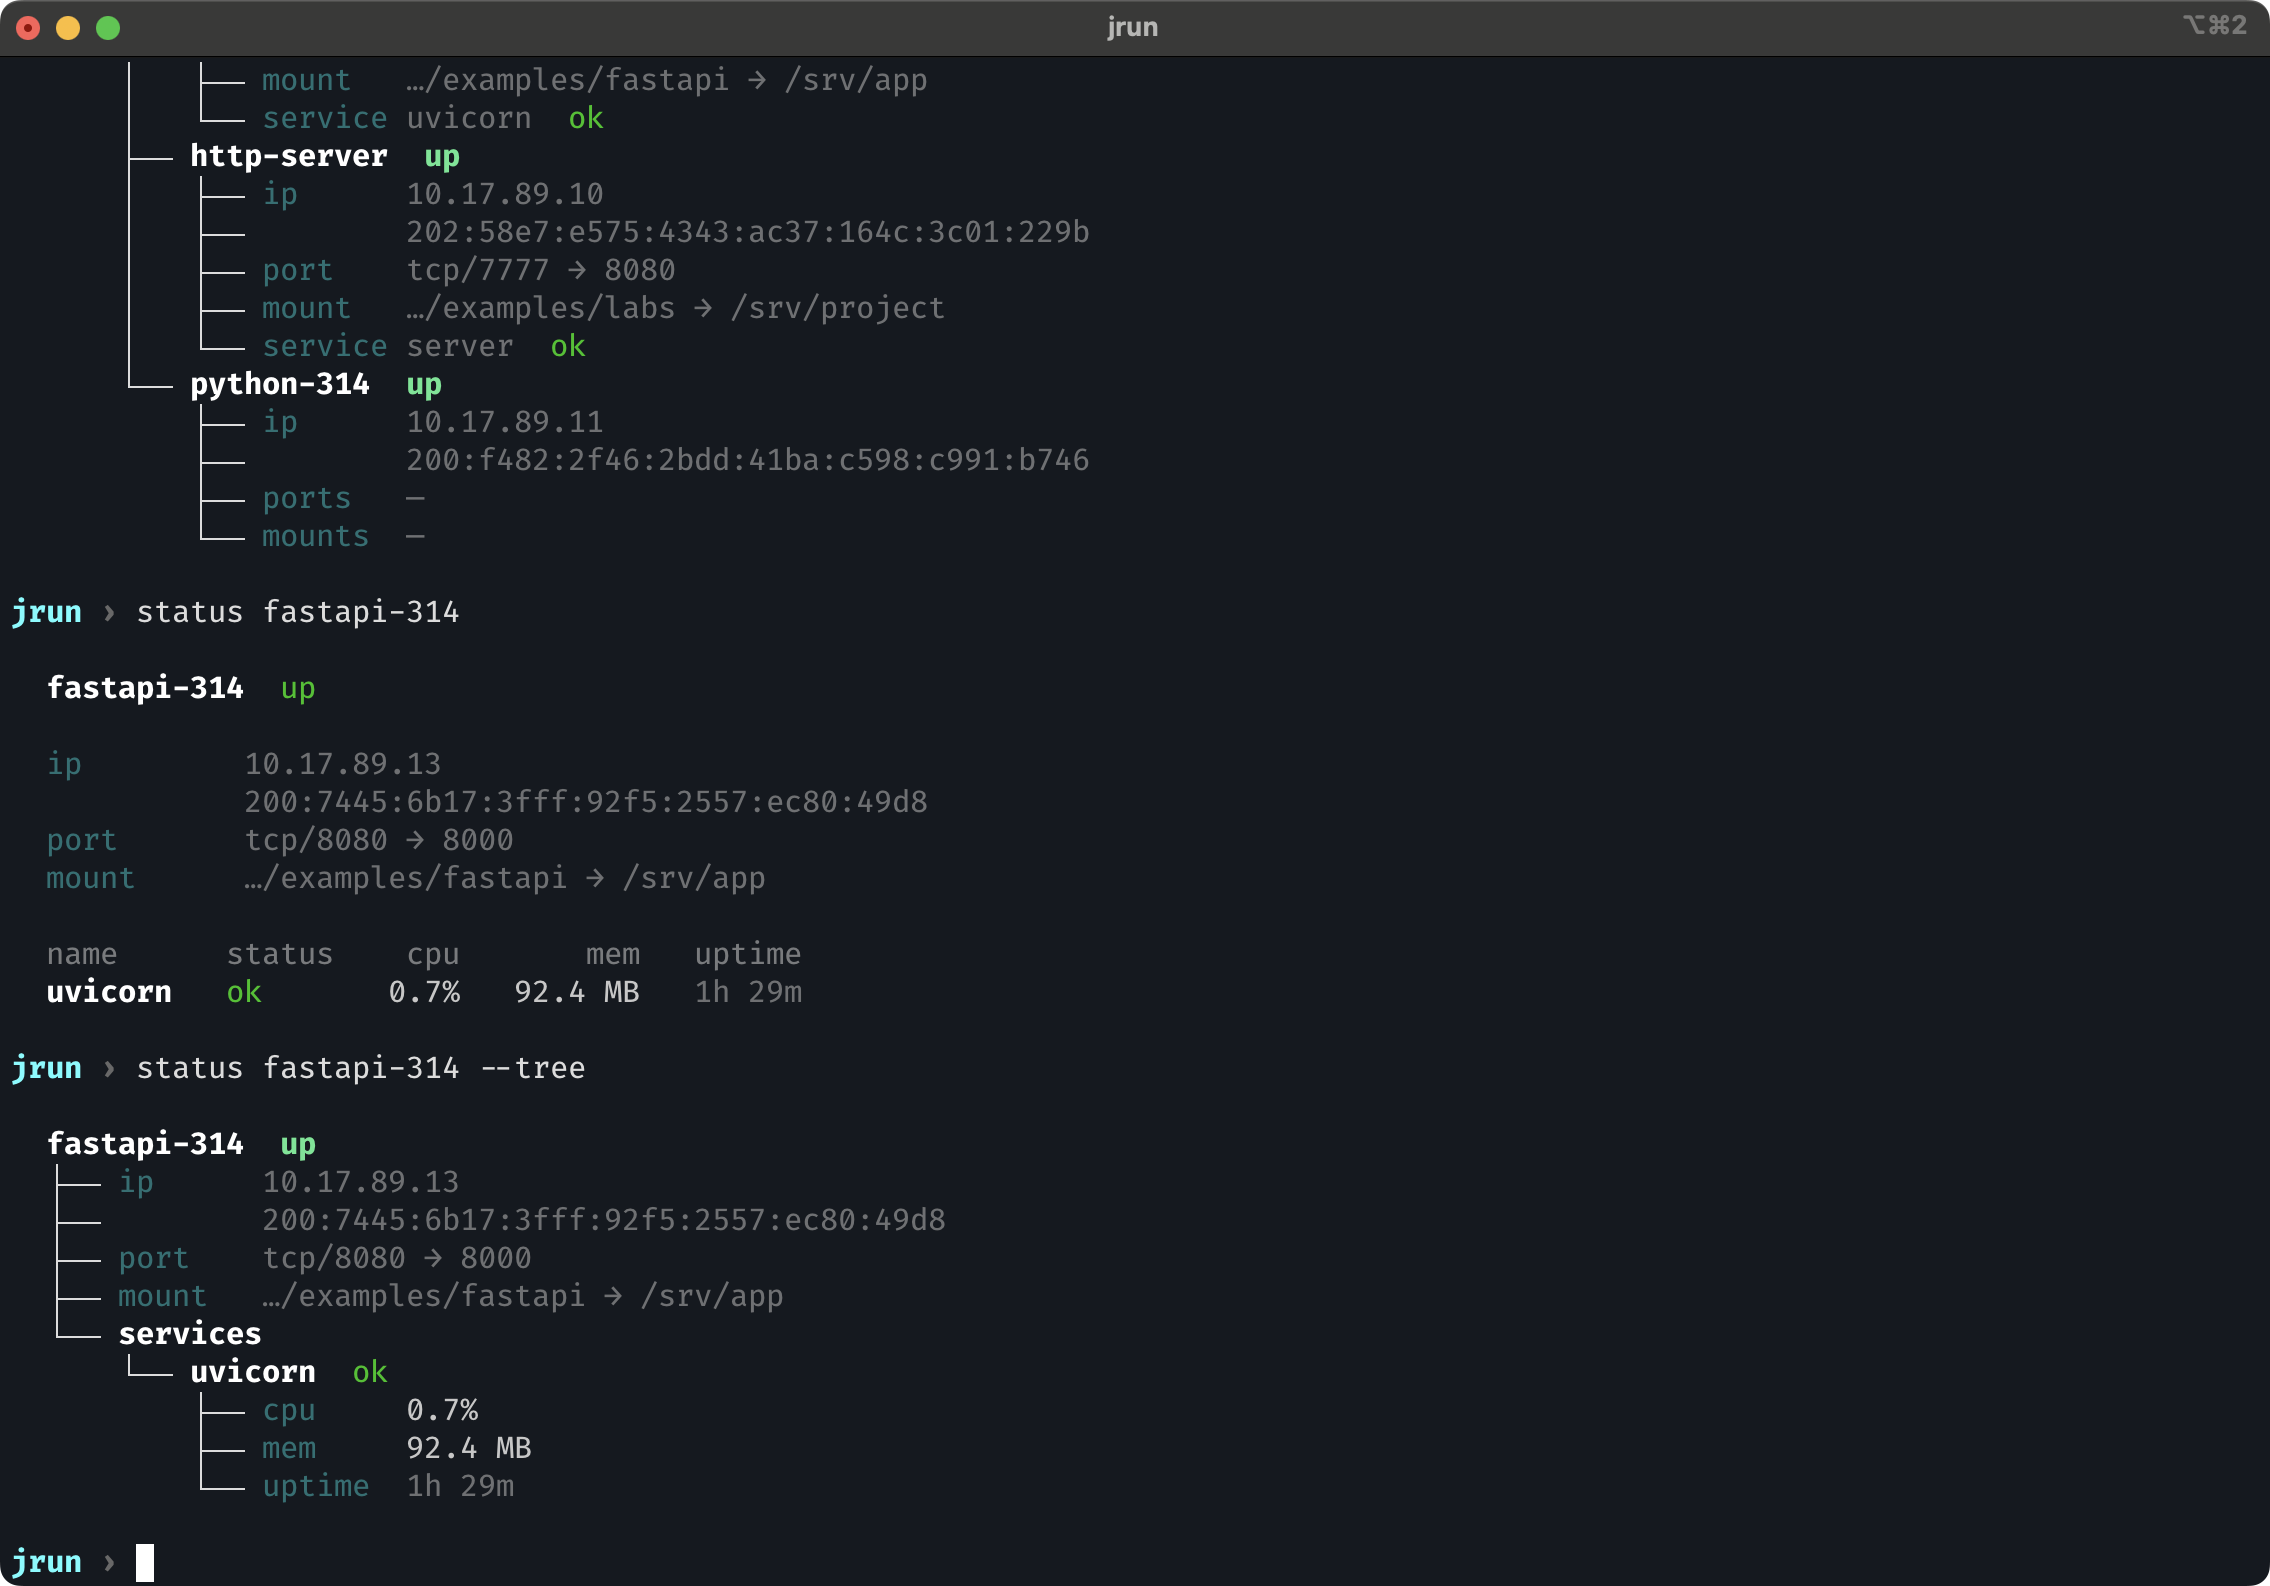
Jail detail
Pass a jail name to see its full detail view:
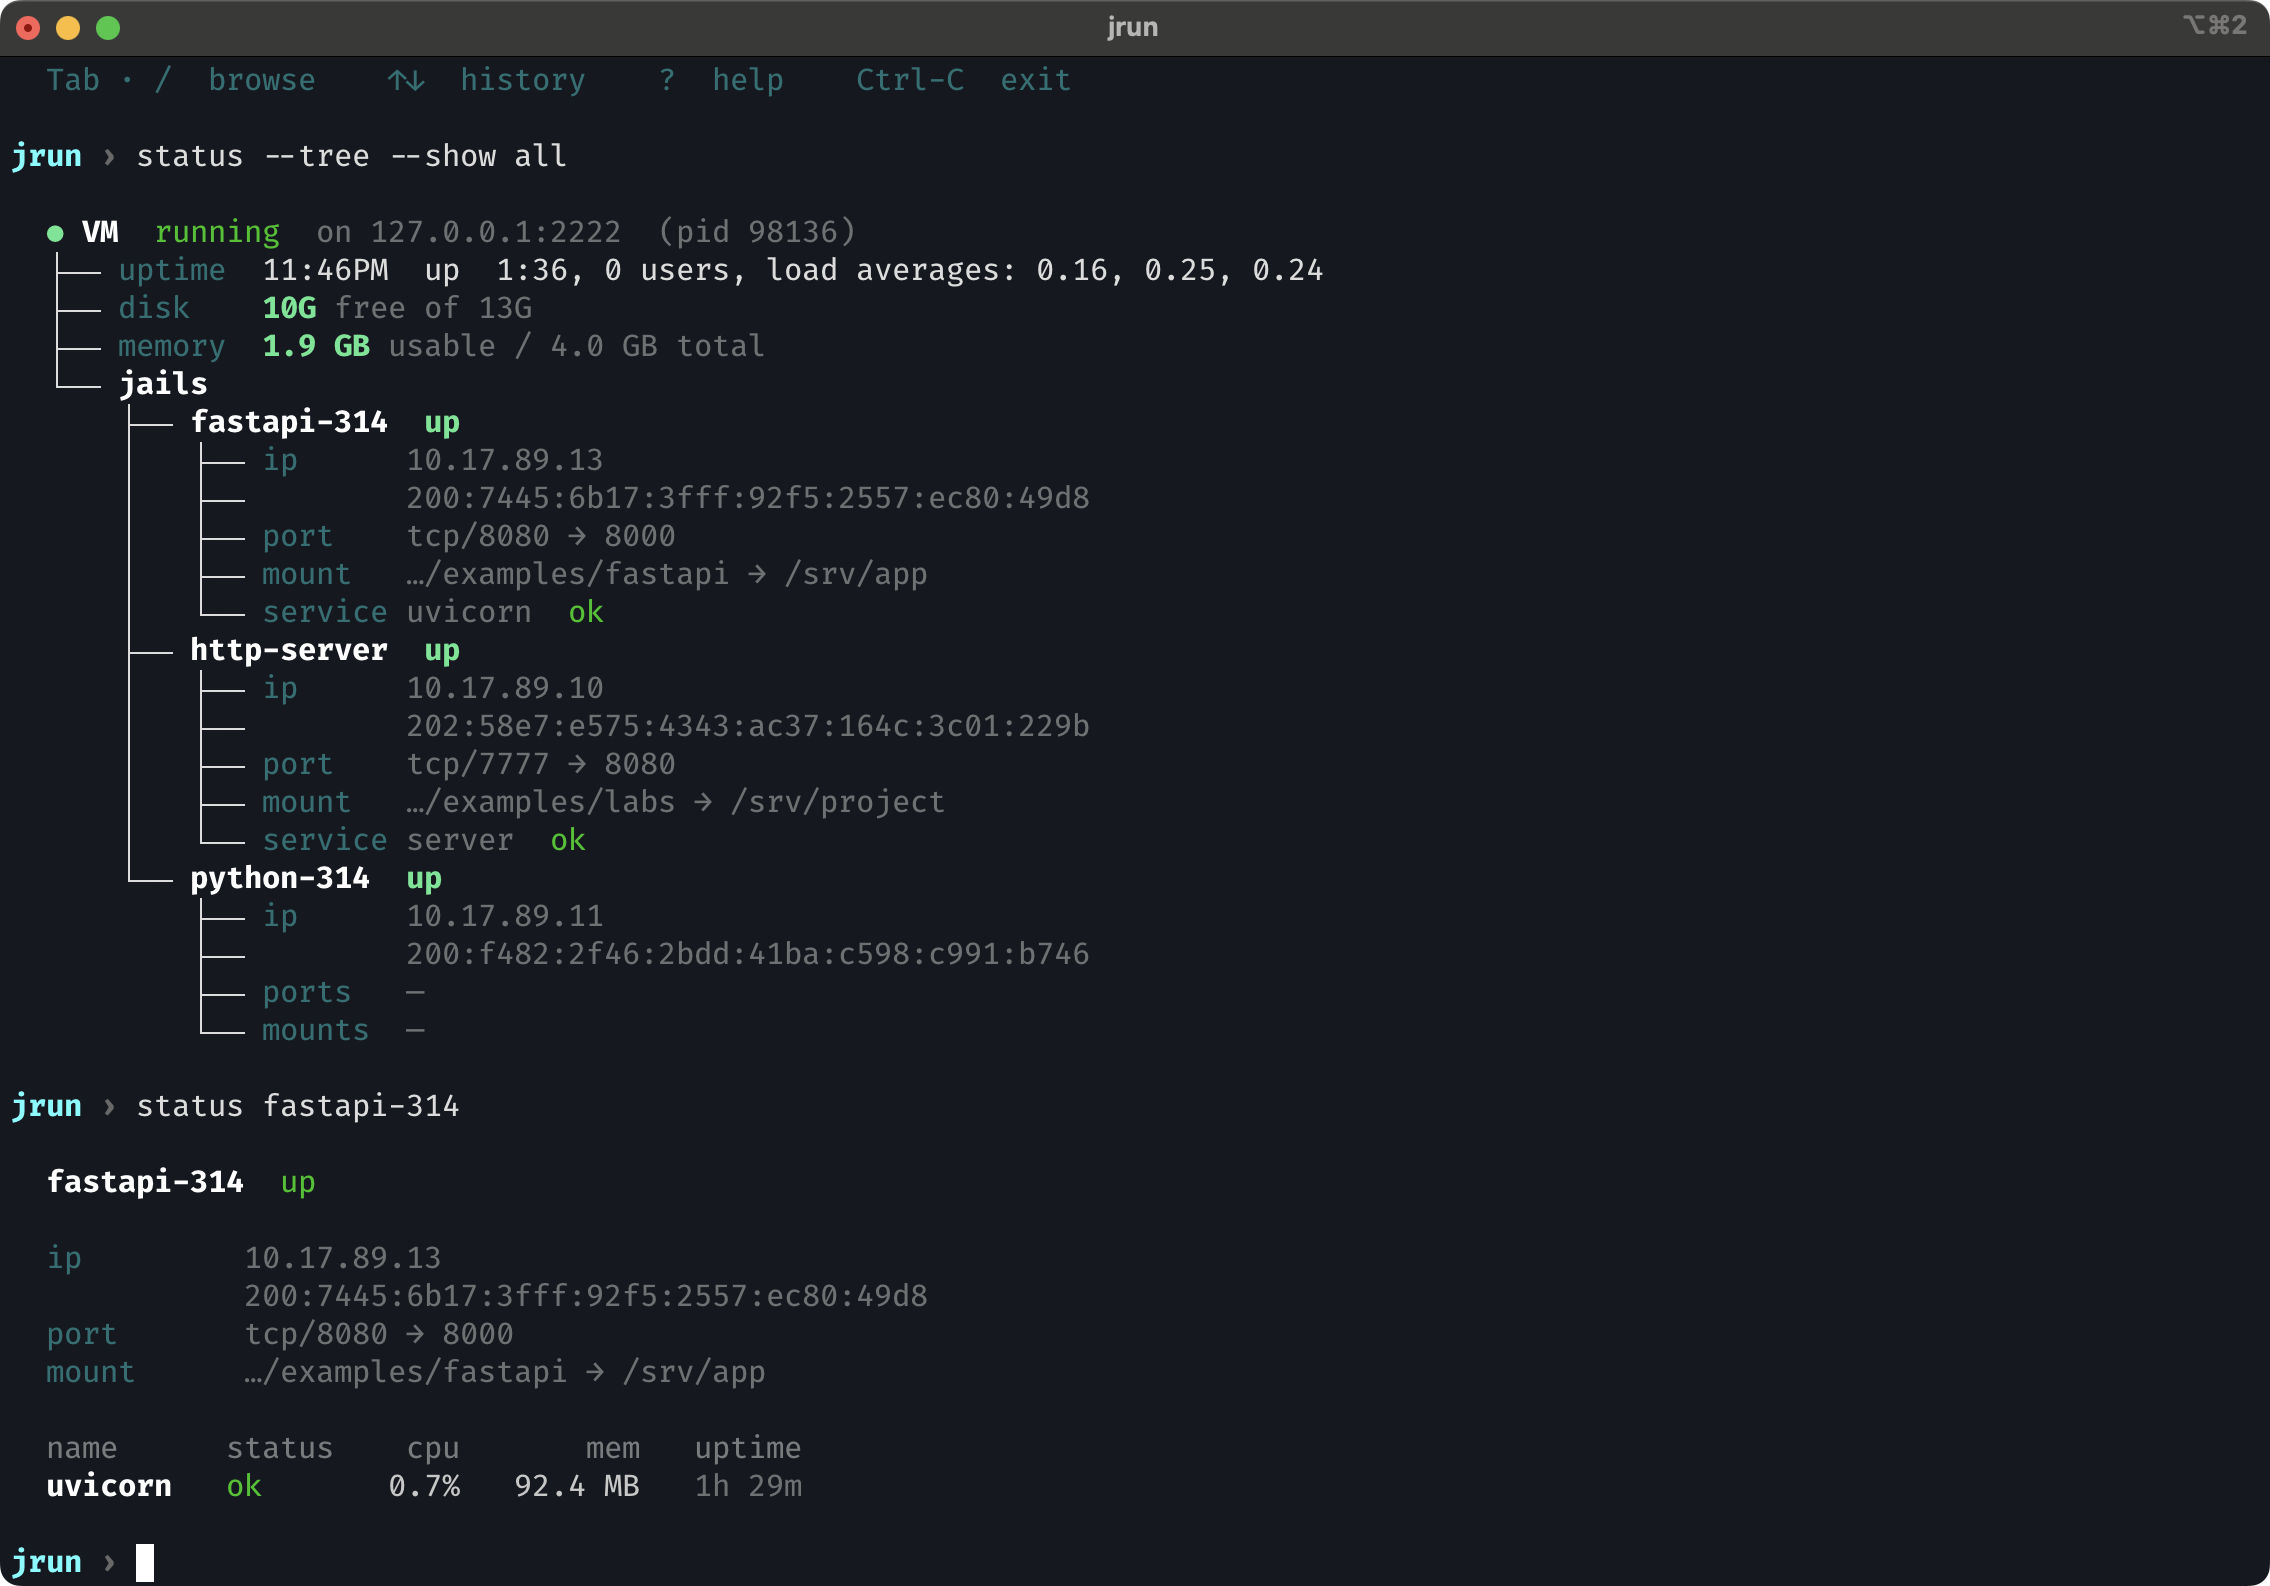
The detail view shows monit service metrics (cpu, mem, uptime) when available.
Detail tree view
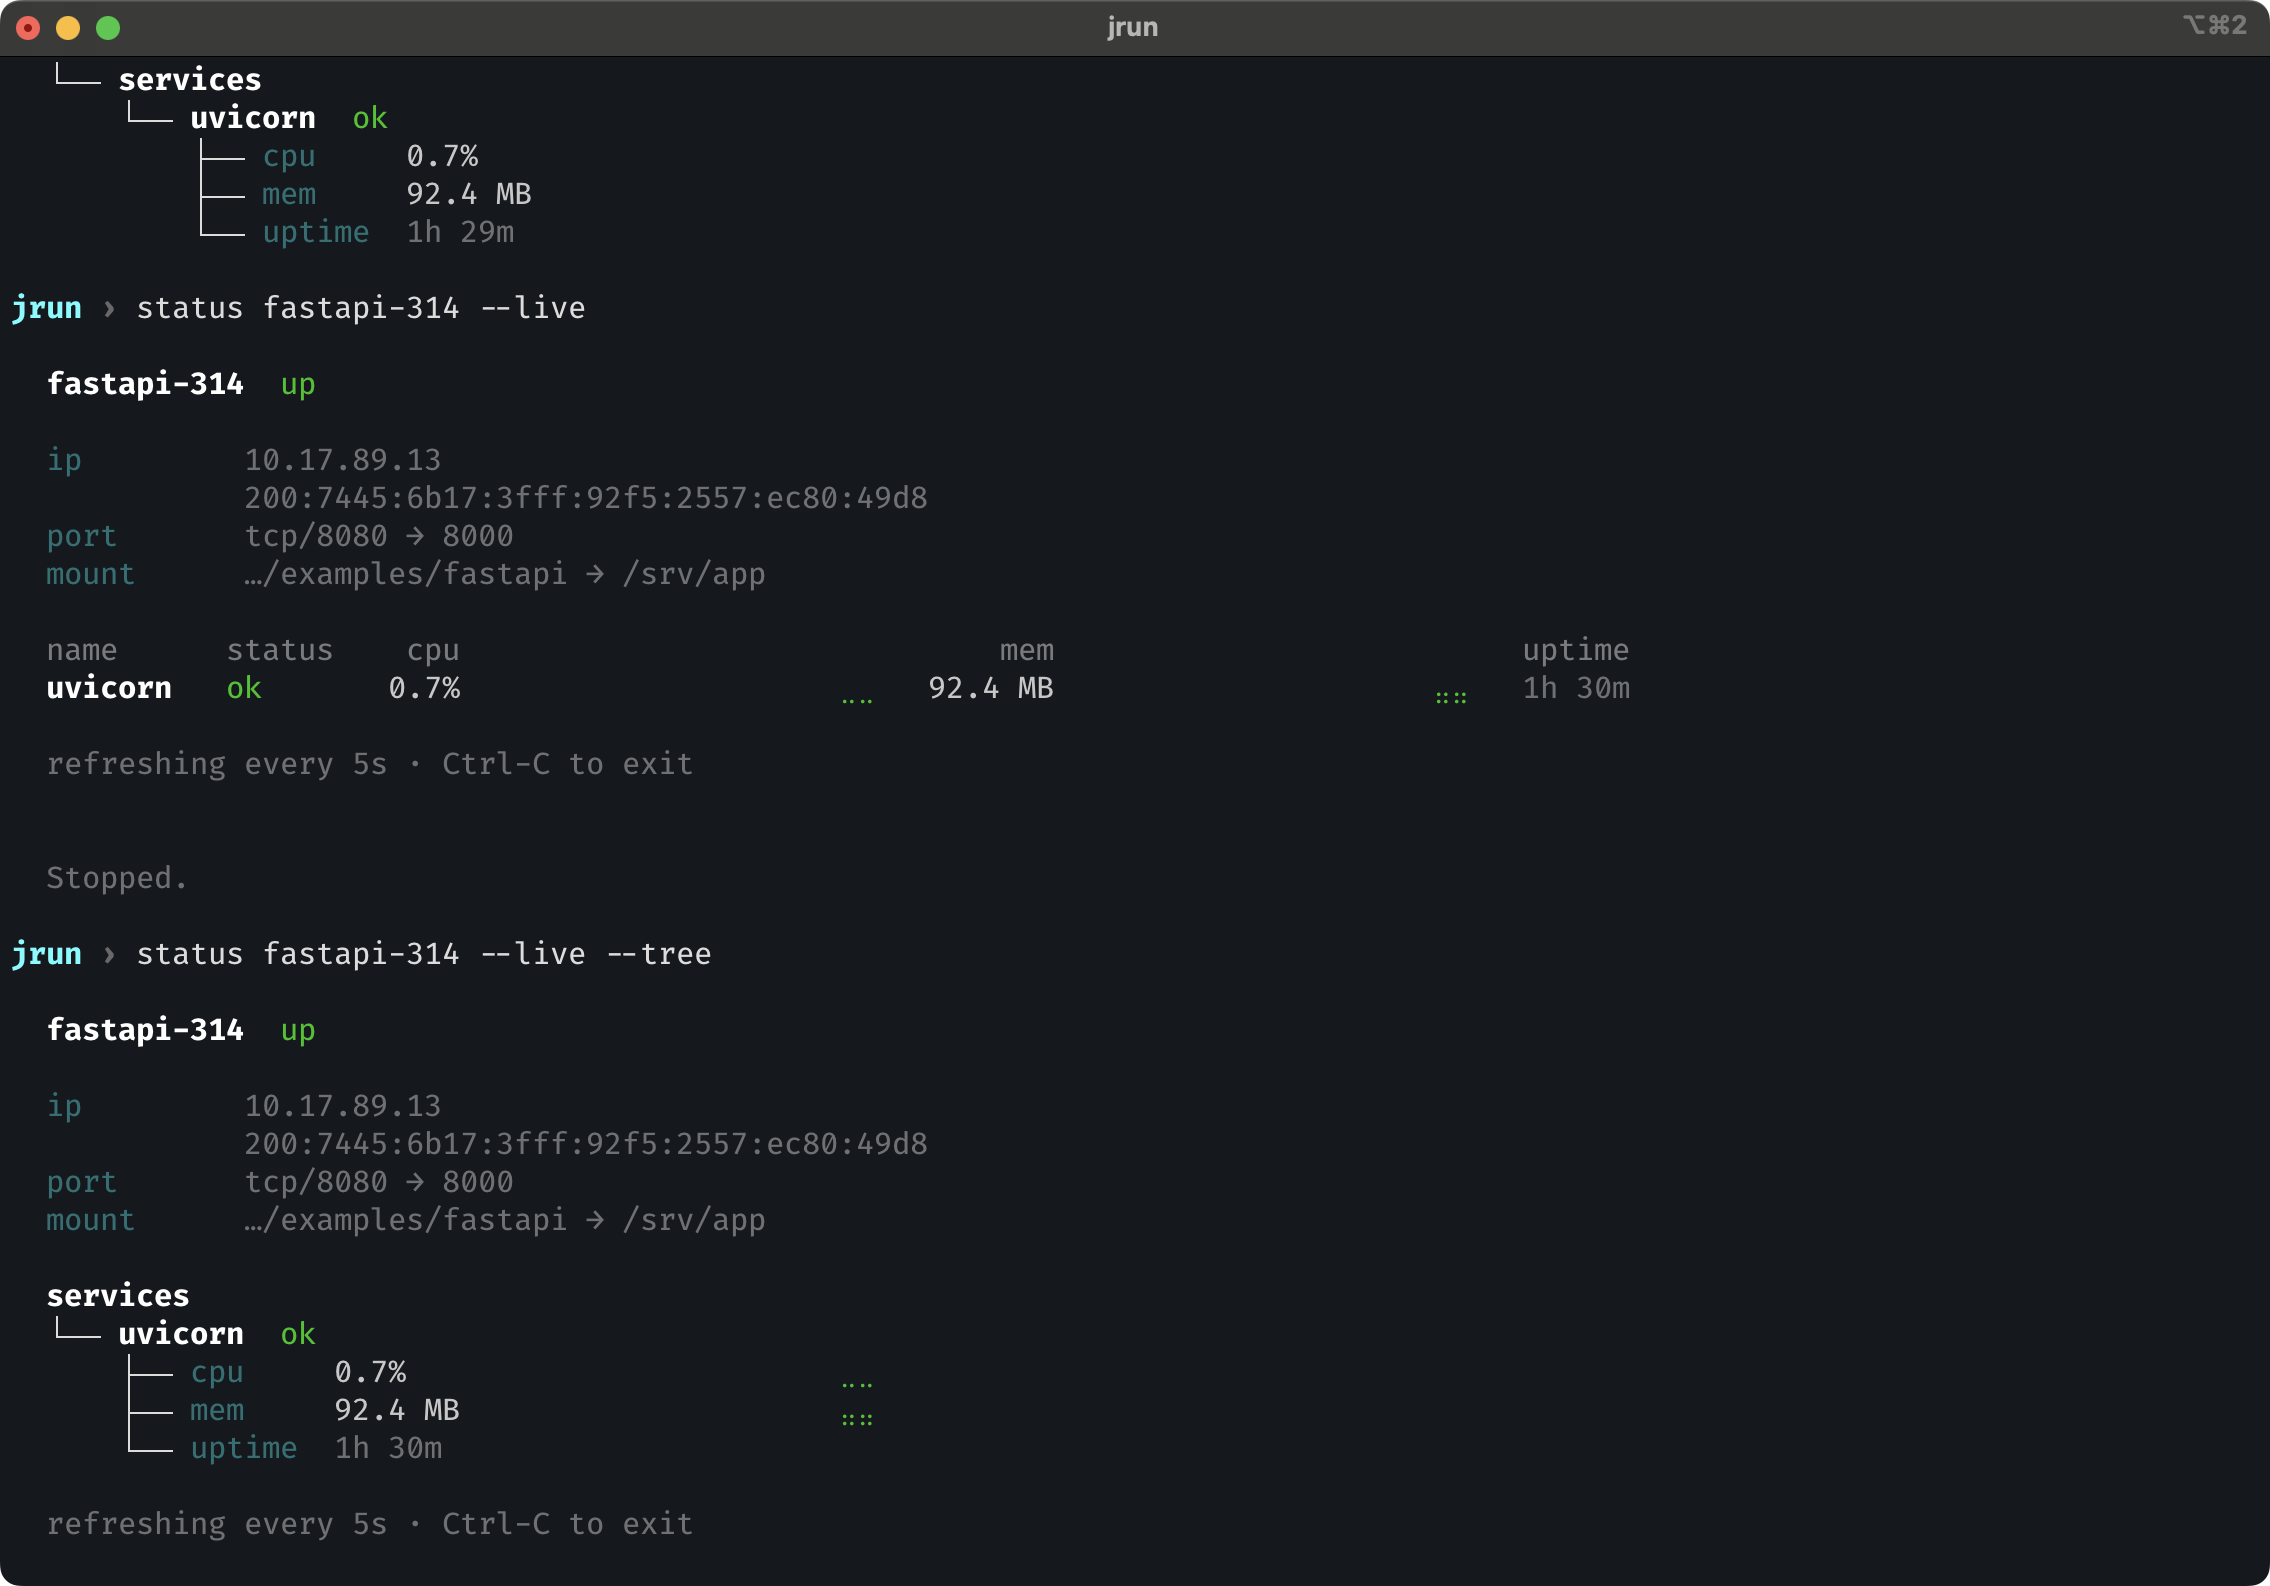
Live monitor
Watch service metrics in real time with CPU and memory sparklines:
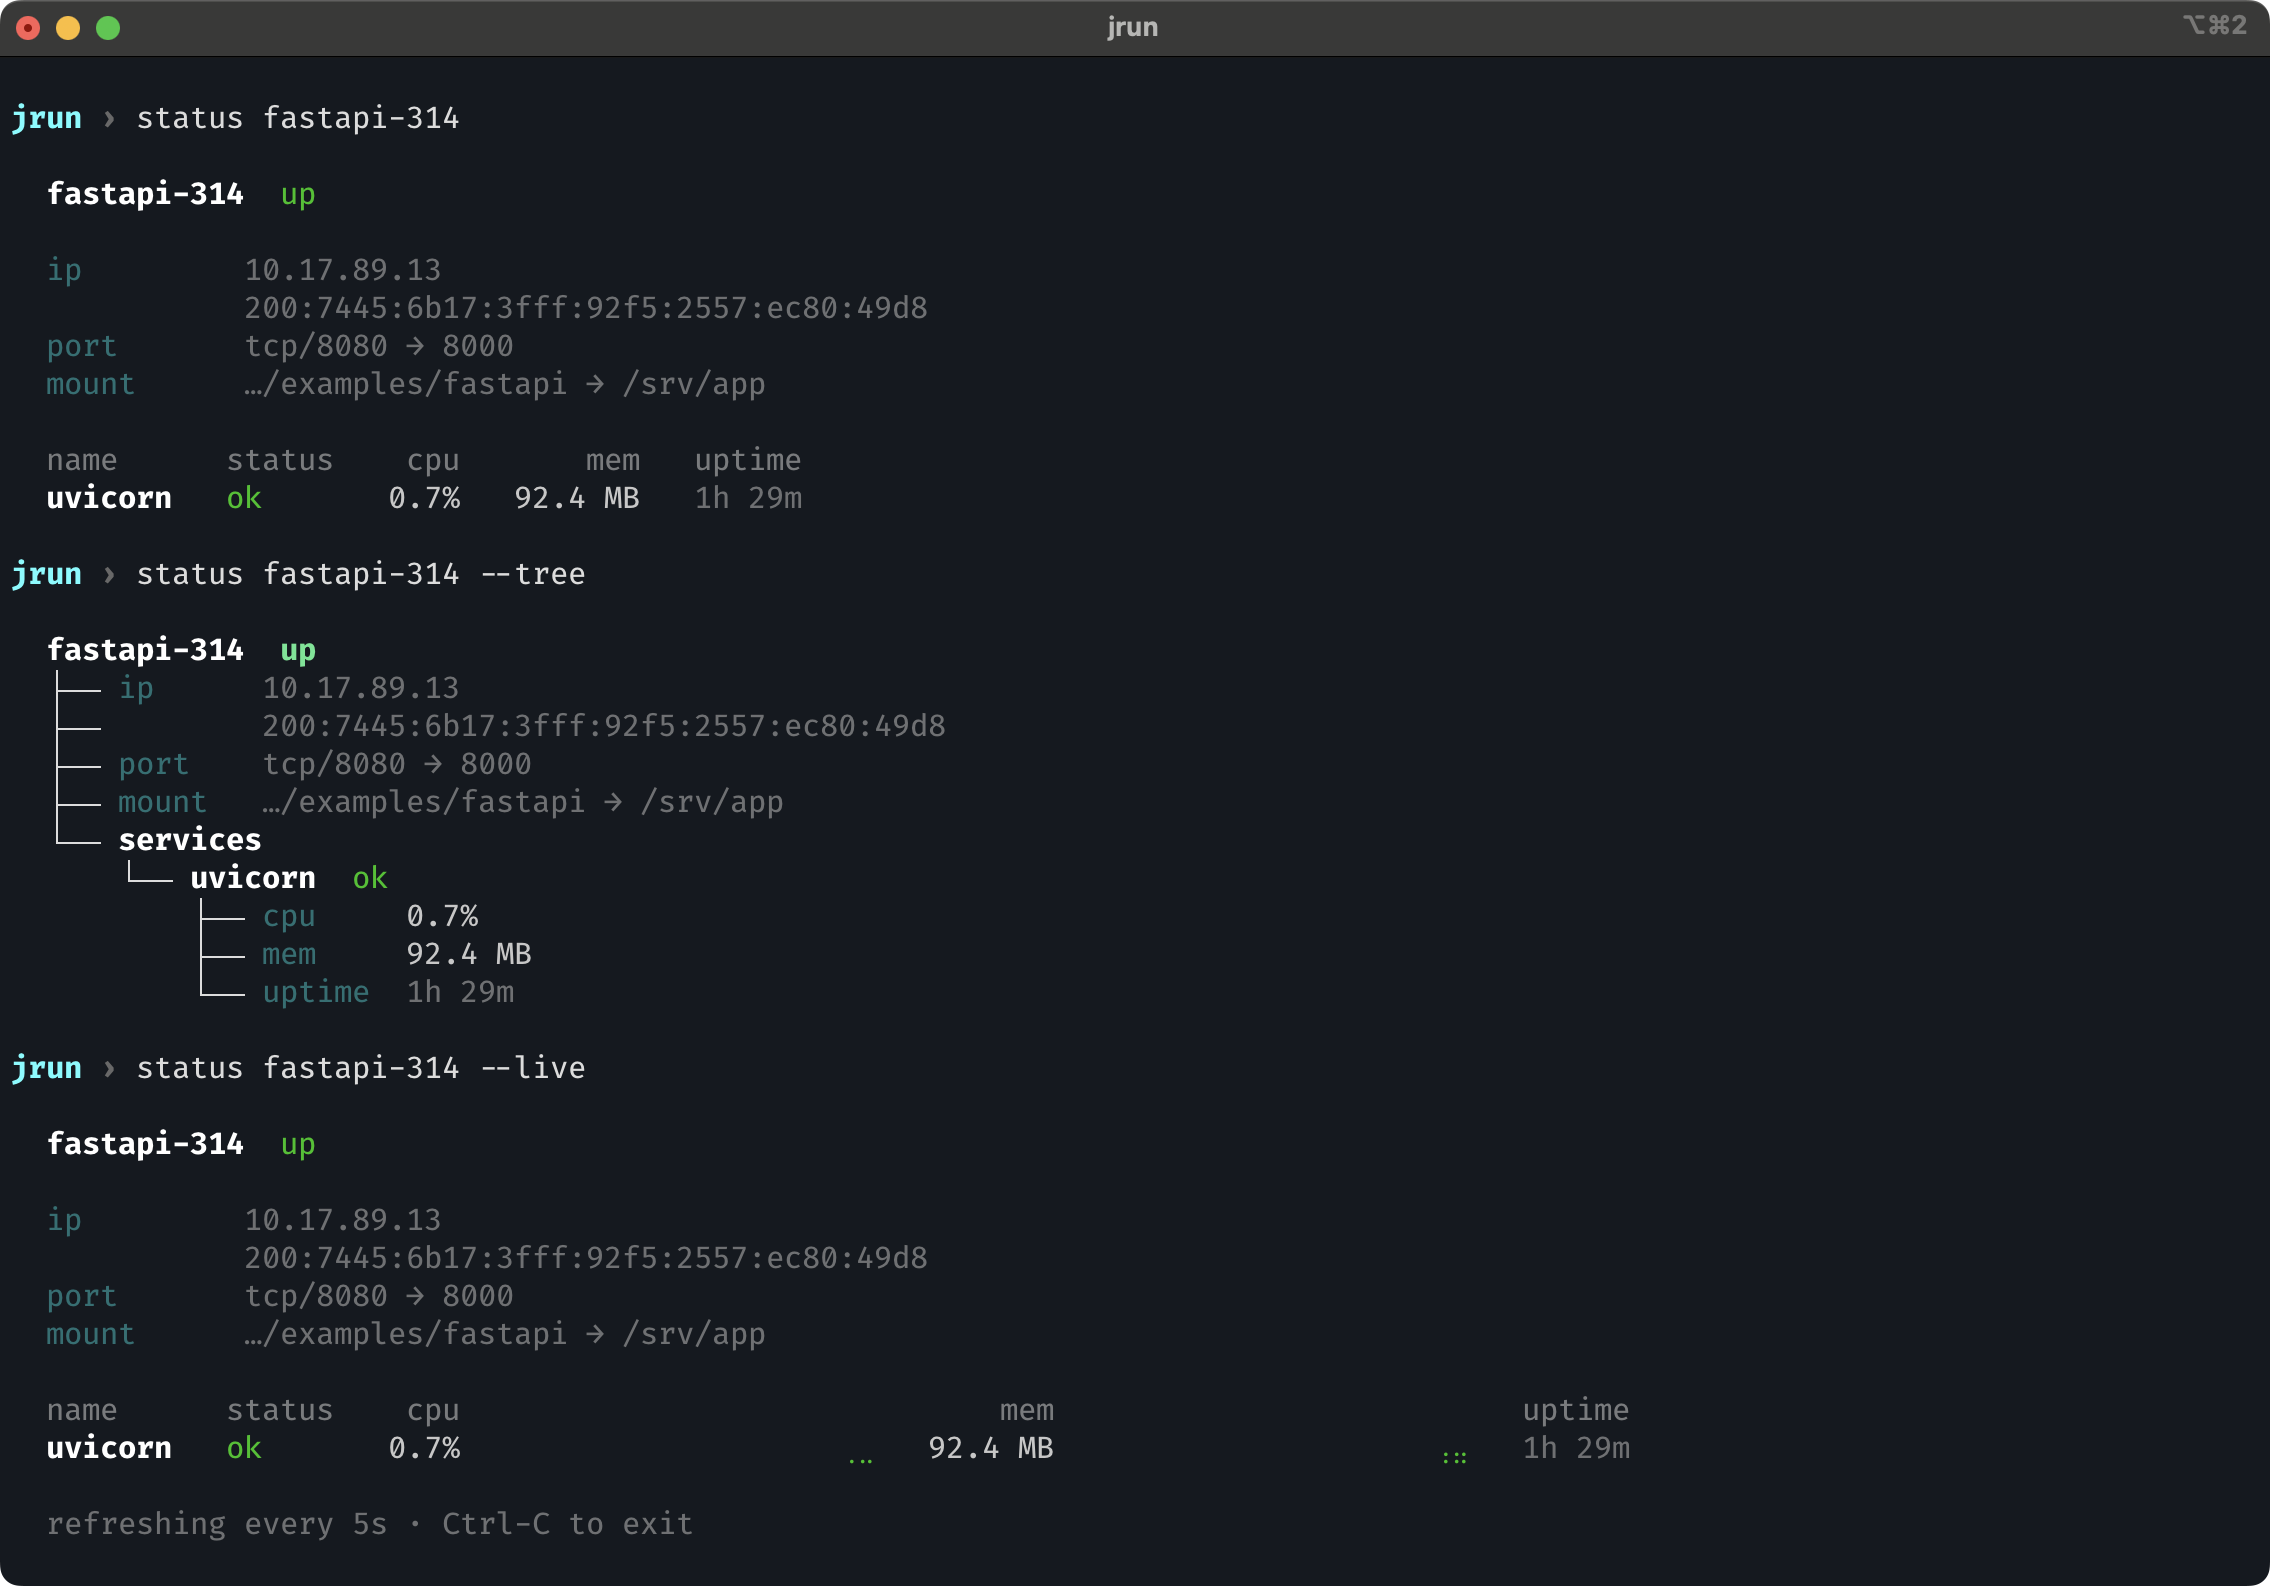
The display refreshes every 5 seconds. Sparklines show the last 20 samples.
Live tree view
Same data rendered as a tree instead of a table, with sparklines inline next to each metric.
Options
| Flag | Short | Description |
|---|---|---|
--tree |
-t |
Render as tree instead of table |
--show |
-s |
Extra columns: ip, services, all |
--live |
-l |
Live service monitor with sparklines (requires jail name) |